The fabled GOP political advisor Lee Atwater helped the senior George Bush win the presidency in 1988 by admonishing him to spend more time connecting with voters in bowling alleys. The political equivalent for GOP candidates in this era may be the frequent flyer club at their airport.
First, here’s a reality check for those of you reading this in the first class section: Just 27% of the electorate is a member of an airline frequent flyer club, according to the latest Public Opinion Strategies national survey conducted in April. That’s far fewer than have a grocery store loyalty card (86%), for example. These voters are slightly older than the electorate overall, less diverse, and they are decidedly up-scale – 64% have a household income of $80,000 or more and 69% have a college or post-graduate degree. They are the stereotypical image of how most people describe a Republican – essentially White, older, and rich.
But, here’s the rub. They do not overwhelmingly consider themselves to be Republicans anymore. Among frequent flyers, Democrats currently have a nine point partisan advantage (28% identify as a Republican, 37% as a Democrat and 35% as an Independent or something else). Among all other voters, this partisan advantage is five points. Now, granted that is beyond margin of error, but not huge. What is more significant is how many of these frequent flyers describe themselves as former Republicans. Fully 23% say they used to be Republican, one of the highest proportions of any demographic group we examined and only eclipsed by college-educated men (28%). Nearly half of frequent flyers (48%) describe themselves as ideological moderates.
This defection might not be all that consequential if these were just lackadaisical voters who have unplugged from the system, but frequent flyers are decidedly “plugged in.” Fully 95% have a home computer, 49% use social networking sites like Facebook (20 points higher than non-frequent flyers), and 64% say they follow politics and news event very closely (again, 20 points higher than non-frequent flyers).
It will not be an easy task to lure these voters back to the GOP. Nearly two-thirds (64%) approve of the job President Obama is doing now, and a majority (55%) say they like Obama and his policies. GOP ideas and messages are also not getting through to even these very plugged in voters. Just 16% of frequent flyers say they have seen anything about GOP policy alternatives to the budget and stimulus proposals.
That being said, there do appear to be openings. While the rest of the electorate gives Democrats a five point advantage on a generic Congressional ballot, frequent flyers are evenly divided between the two parties. Frequent flyers are most worried by Obama’s policies to increase government spending (30% say this is the main concern they have so far with Obama). They are also evenly divided on the impact of the economic stimulus plan on their family, as just as many say it will hurt their family (40%) as say it will help their family (43%).
So, Republicans may consider striking up that conversation with the person across the aisle. That frequent flyer very well may be the best hope for a GOP upgrade back to political first class.
Using our recent national survey, as well as other public polls, we recently put together an in-depth look at the standing of President Obama, the Congress, and the Republican Party.
We’ve attached it here because we thought you would find it of interest.
[ipaper id=15097732 mode=slide]
Public Opinion Strategies completed a national survey of 800 likely 2010 voters (April 19-21, 2009) where we asked a few demographic questions about cell phones and networking sites such as Facebook and Twitter. As you would suspect only a small percentage (13%) of voters do not have a working cell phone and one-third of likely voters use networking sites such as Facebook, MySpace, Friendster or Twitter.
As has been pointed out in another post about social networking it is experiencing growth like the dotcom industry a decade ago. On four national surveys in 2008 we asked likely voters, “When you go on the Internet, do you ever use networking sites such as Facebook, MySpace or Friendster?” and after merging the results of 3,200 interviews just 19% of likely voters said they used social network websites.
In less than a year, almost twice (34%) as many voters now say they use social network sites. While the question wording now includes Twitter other studies show that Facebook is growing very quickly, so not all of the increase in the use of social networks is a result of Twitter users.
I also looked to see if there were any differences among users and party identification. Look at the significant differences of social network use by party identification.
Use Social Network Sites
GOP
Ind
Dem
Yes (34% overall)
29%
37%
38%
Does this mean Republicans are more reluctant than Democrats to use social networking sites? Or could it be that Democrats are doing a better a job than Republicans by using social networking sites to organize and build the party? I don’t know the answers but with the exponential growth in social networking, Republican campaigns need to do a better job of using these types of sites for our benefit.
What does this mean for campaigns? Think back just a few short years ago to 2006 when political campaigns were trying to figure out how ways to take advantage of technology in cell phones and social networking sites such as Facebook only had 8 million users, who were primarily college students. For 2010, campaigns at all levels need to have not just a presence on social networking sites but make it an active part of their campaign.
The Philadelphia Inquirer reports that Tom Ridge will not run for Senate in 2010, despite the results of a recent POS poll that put him ahead in hypothetical matchups against Republican Pat Toomey and possible Democratic challenger Sen. Arlen Specter.
On his National Journal blog, Charlie Cook mentions recent POS polls in reference to the number of voters who identify themselves as independents rather than aligning with a party.
In their April polling — actually March 31-April 21 — among 3,013 adults, with a 2-point error margin, Democrats were ahead 33-22 percent, with independents up to 39 percent.
A survey by the Republican polling firm Public Opinion Strategies last month showed numbers that track largely along the Gallup and Pew lines.
Politico quotes Glen Bolger concerning his opinion on how citizens will feel about moving Guatanamo Bay detainees to U.S. if President Obama successfully closes the prison.
GOP pollster Glen Bolger called the strategy a homerun for a minority party that has had difficulty finding a potent issue to play off of.
“Gitmo is NIMBY on steroids,” Bolger said. “All in favor of having Gitmo terrorists housed in your Congressional District raise your hand. Whoa — no hands go up!”
“This issue is at the intersection of good policy and good politics. That’s been a rarity for the GOP over the last few years,” Bolger said.
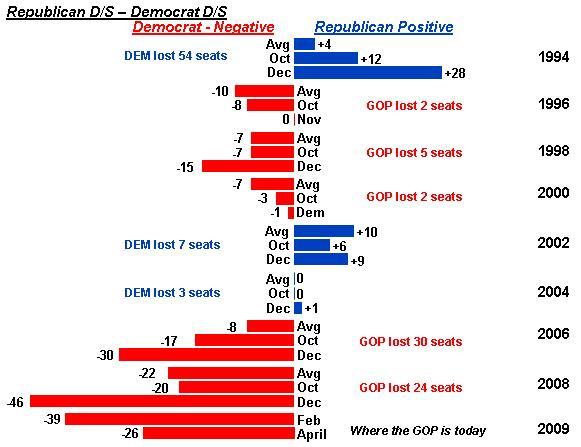
Predictions of the Grand Old Party’s demise are exaggerated, the numbers show a party clawing its way out of the grave. Look at the simple chart below. It’s an amalgamation of two sets of numbers, all taken from a huge data of information taken from NBC News-Wall Street Journal surveys. It explains a lot.
The first thing we learn is that when the Republican party’s image has a favorable advantage over the Democratic Party (positive numbers, on the right side) like in ‘94 and ‘02, the GOP won seats in the House (54 and 7 respectively). At the same time, when the GOP’s image is net-negative compared to the Democrats, the GOP lost seats (on the left) like ‘96, ‘98, ‘00, ‘06 and ‘08 when we lost 2, 5, 2, 30 and 24 seats respectively.
The greater the GOP advantage (like ‘94) the greater the number of seats won. On the flip-side the greater the deficit (like ‘06 and ‘08) the greater the number of seats lost. Simple, and it works every time.
The first obvious conclusion is things have things have gone very badly for the GOP the last two cycles. Republicans went into ‘06 with a 17 point deficit and lost 30 seats in the House; in ‘08 the GOP had a larger 20 point deficit and lost an additional 24 seats.
So where are we now? The 46 point deficit that plagued the Republican Party just after election day has shrunk to -26 points in five months. Pessimists would read that the GOP is almost back to the point where it lost a combined 54 seats in the House between ‘06 and ‘08.
The rehabilitation of the GOP will take time, but the fact is the GOP is improving at a rate of four points a month.
While the data also shows that the pace slows once a party gains the voters they should have in the first place, in six-to-ten months the GOP could be at parity with the Democrats given the current clip. The GOP will need to do better than parity to make significant gains though: as the chart shows, the GOP needs a double-digit lead by October of ‘10 to make double-digit gains.
As a sidebar, the winning party’s advantage coasts upward AFTER election day as the public reaches a consensus that rationalizes its action at the ballot box. After the Republican Party’s sweeping wins in ‘94, its advantage over the Democrats more than doubled from +12 to +28 after election day. On the other hand, after ‘06’s losses, its deficit jumped from -17 points measured in October to -30 points in December. ‘08 was worse: the ‘20 point deficit the GOP carried into election day collapsed to -46 points after election day.
Either America doesn’t like losers after they lose or we all want to be on the winning team. Either way, the result is the same and reflected in the comparison.
The image of the Republican Party is not the only thing that’s on the mend – we’ve seen similar closing in the generic congressional ballot in recent months – now tied to -5{09f965da52dc6ab4c1643a77bd40d1f729d807040cd8db540234bb981a782222} for Republicans.