Heat map displays are a unique feature of the mobile survey application. It allows respondents to view an image on their phone or tablet and select the areas that most catch their attention. Respondents then type in a short verbatim response as to why they selected that area.
This feature could be utilized for:
- Print ad testing
- Candidate biography testing
- Campaign mailer testing
- Screen shot testing
- Website testing
- Logo testing
- Mobile application testing
Our national survey used campaign images of Hillary Clinton for our heat map section.
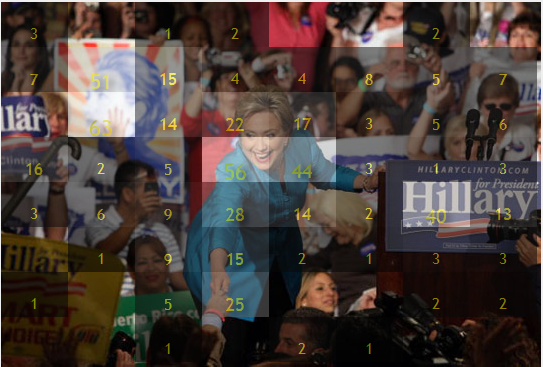
What we learned:
- Heat maps allow participants to react viscerally to visual message testing.
- Participants provided brief emotional responses to the tested visual.
- Heat maps bring the most important aspects of visuals into focus for analysis.
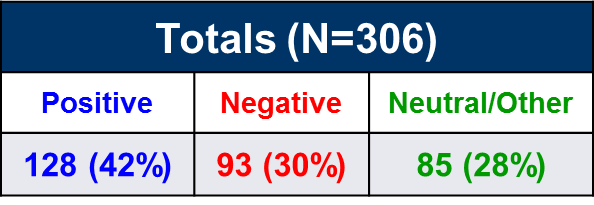
- As these results show, Hillary Clinton is quite a lightning rod. Respondents had intense reactions to her – although more positive than negative.
Here are some charts with a full explanation and analysis of the heat map.