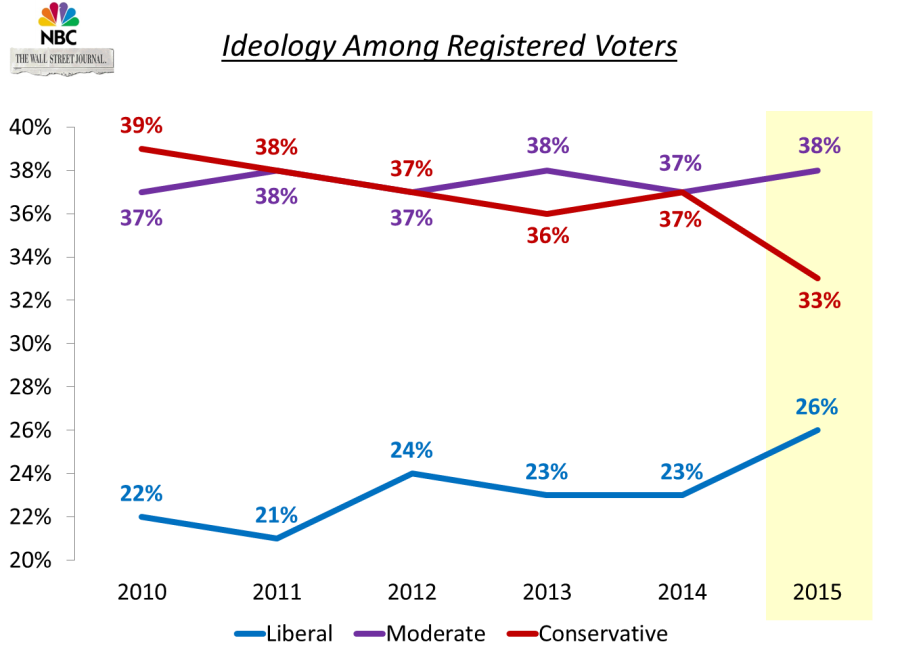
For years, ideology has been a fairly stable measure of public opinion. Here are the trend lines on ideology from the NBC–Wall Street Journal polling merge data among registered voters that typically contain 8,000–12,000 interviews per year:

However, in the three NBC–Wall Street Journal surveys conducted so far this year (N=2,400 registered voters), we have seen a shift that is quite large considering how stable the data has been.
The following page shows sub-groups that have shifted from net conservative in 2010 to net liberal in 2015, ranked by net liberal.

If there is one thing I really do not like in polling analysis, it is speculation. The obvious question here is, what is causing this shift?
Well, here is one answer that is not the cause of the shift: an appreciable difference in party identification. The difference in partisanship between 2010 and 2015 is quite modest and does not account for this change in ideology.

Our first step is noting the change. Our second step will be designing appropriate questions to understand what is driving the change and figuring out if this is just a blip or if it is an emerging trend.
Stay tuned!
Polling for NBC and The Wall Street Journal is conducted by Democratic pollster Fred Yang and me. This analysis is my own and does not necessarily reflect the views of NBC, The Wall Street Journal, or Hart Research Associates.